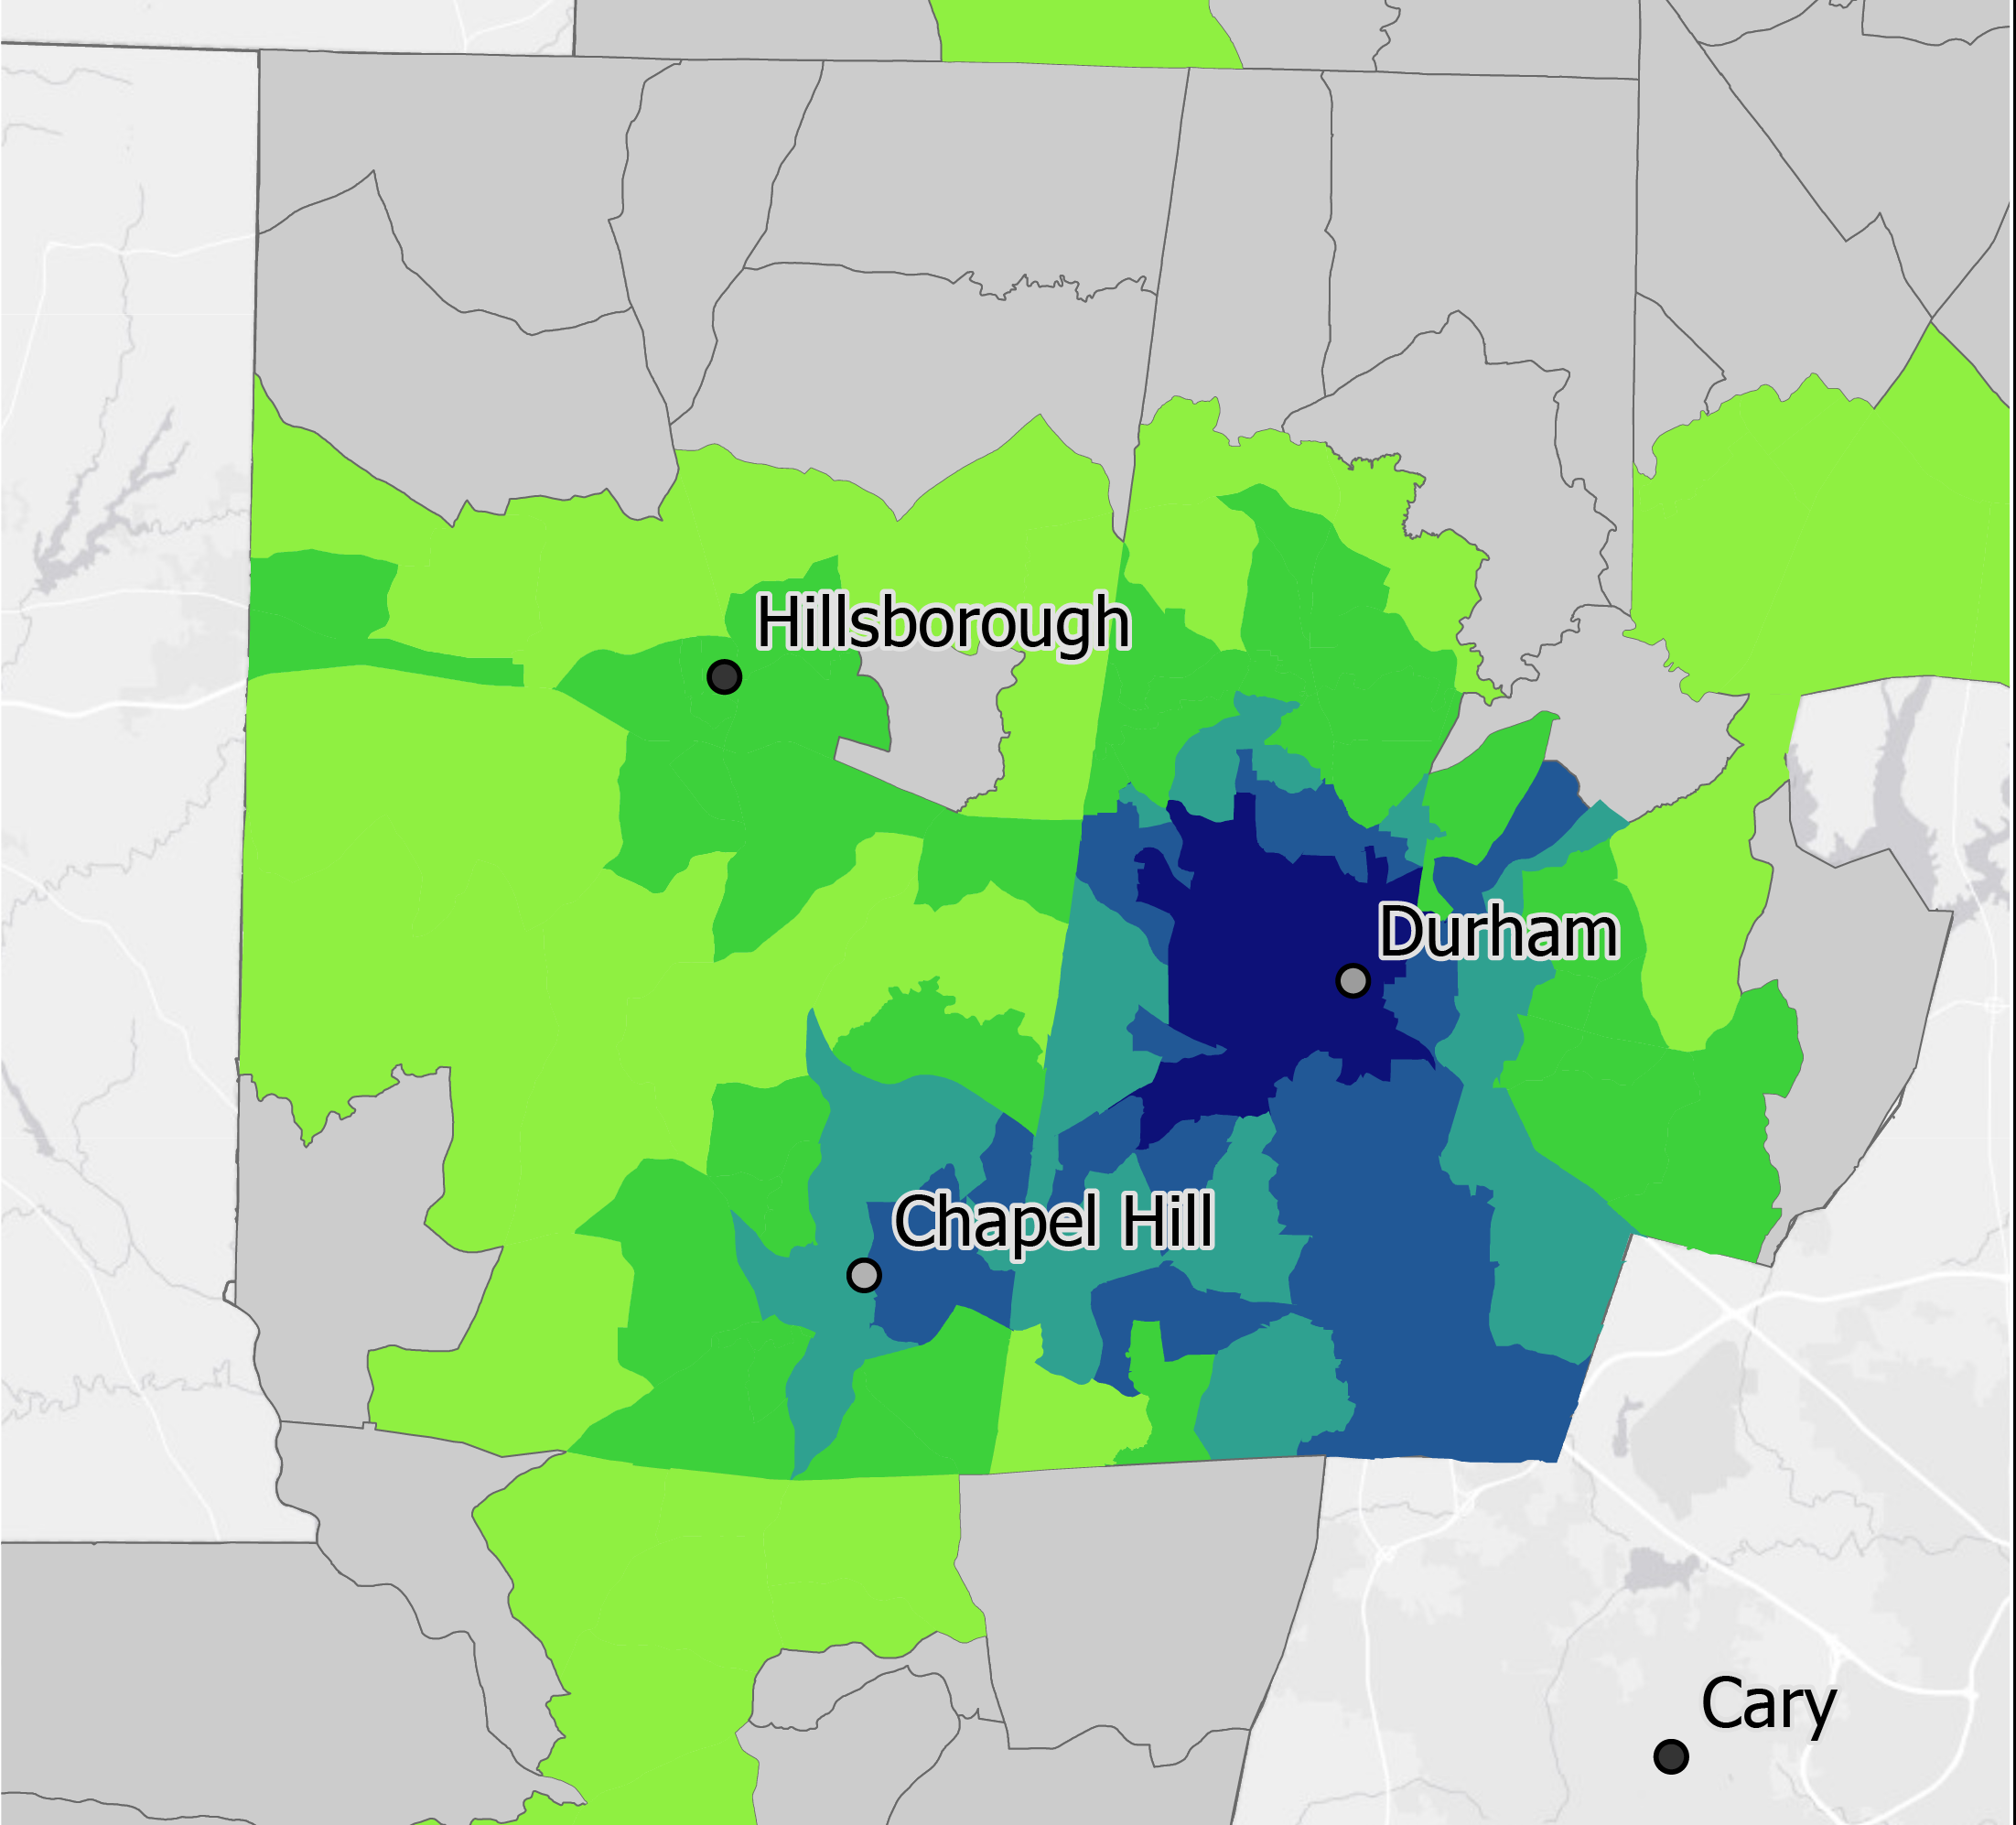
Map showing the distribution of food sources in the Durham-Chapel Hill MSA by block group.
Even with over 2,000 restaurants, grocery stores, and convenience markets, many neighborhoods in the Chapel Hill-Durham Metropolitan Statistical Area (MSA) struggle with uneven access to food sources – especially sources for healthy food. UNC Public Policy PhD Candidate Zahra Al Hamdani studied this topic by focusing on the intersection of food accessibility and community characteristics to identify disparities. Al Hamdani analyzed the distribution of food sources in the MSA to create a food accessibility measure at the block group level, which was then compared against demographics such as race, ethnicity, and income. Food sources were classified into 6 categories (restaurants, convenience stores, farmers markets, etc.) to analyze how accessibility varied between categories.
The GIS Librarian, Data Analysis Librarian, and Digital Research Support Specialist helped Al Hamdani access and prepare demographic data from the Census Bureau and business data from Reference Solutions by Data Axle (formerly known as ReferenceUSA). Reference Solutions data provided locations and categories of food sources in the study area. Network analysis was used to determine accessibility for each block group. Using demographic data and the accessibility measure, the Data Analysis Librarian helped Al Hamdani determine whether food accessibility and demographic measures were correlated. Of the demographic measures, Al Hamdani found correlations between food access and race, household size and home age. Block groups with a higher median access to food outlets are positively associated with median home age and the percentage of non-white residents and negatively correlated with household size.


