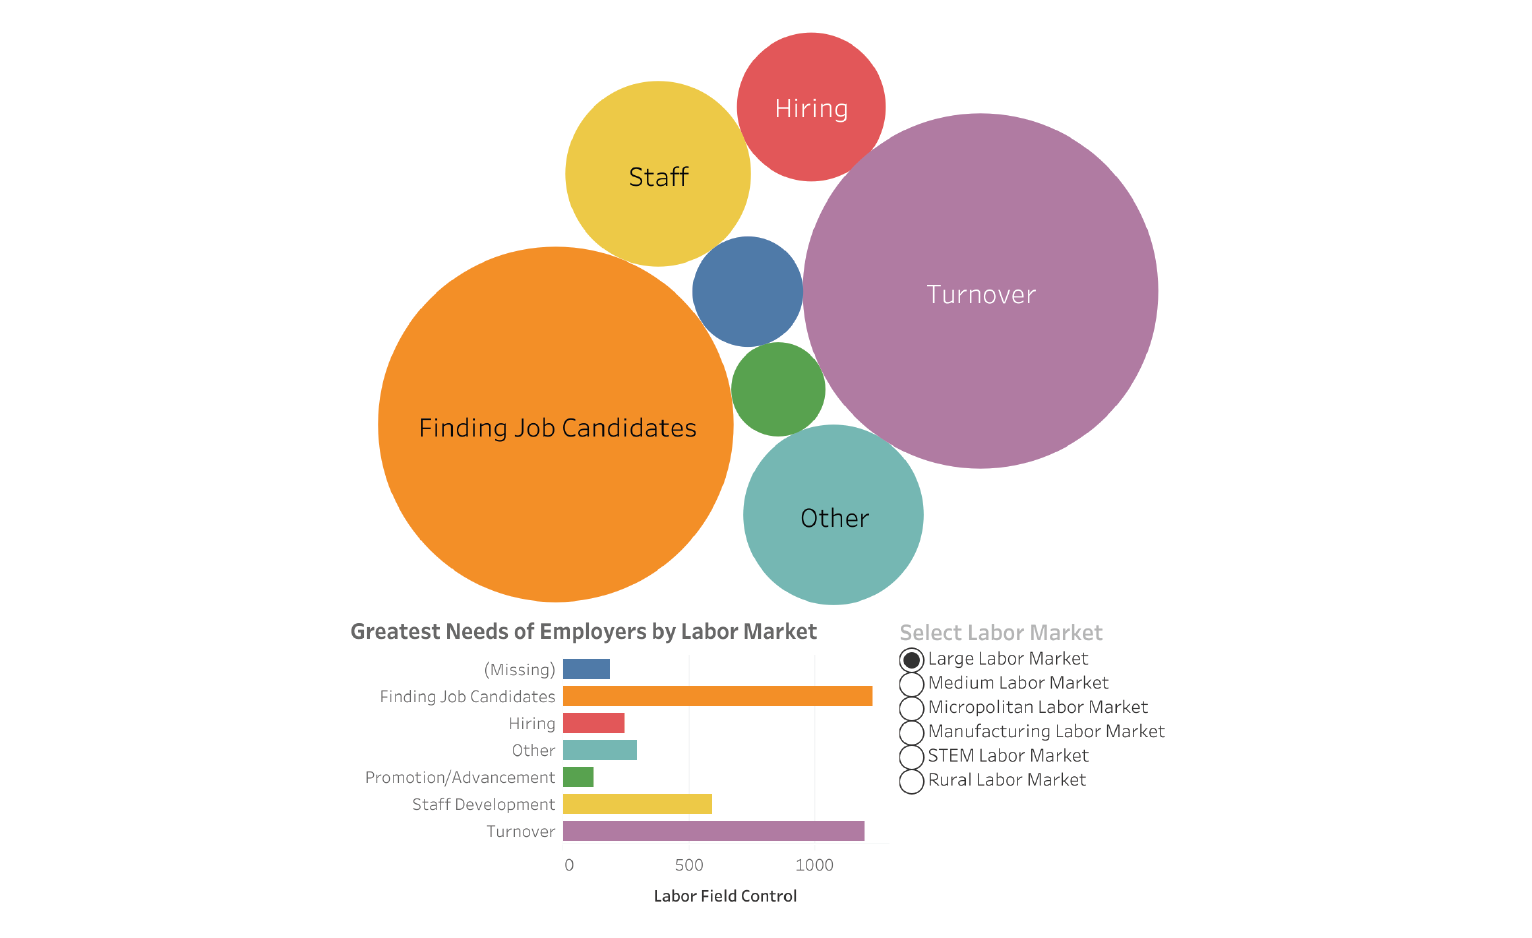
Which types of North Carolina employers struggle the most with hiring? With turnover? Staff development? For a class project, UNC journalism major Erynn M. Affeldt used Tableau to visualize the greatest needs of NC employers by labor market. She drew upon the results of the 2018 Employer Needs Survey, conducted by the NC Department of Commerce. The Research Hub Data Visualization Librarian helped Affeldt input the data to Tableau, produce a bubble map, and fine-tune the visualization.
The resulting Tableau Public dashboard displays the breakdown of NC employers’ needs by sector, as well as by category of need. Affeldt partnered with Rebecca Ayers, a business journalism student from another class, for an NC Business News Wire article on the report. The article features Affeldt’s visualization, illustrating the most significant results of the survey.
As reported in the article, half of NC employers surveyed reported difficulty hiring. STEM-related businesses and manufacturing companies reported the highest rates of difficulty finding qualified employment candidates. Geographically, medium metropolitan areas—rather than rural regions, as expected—reported the most difficulty hiring. Overall, Affeldt’s visualization shows the increasingly tightened NC labor market.
Affeldt’s class project was for Data Driven Journalism (MEJO 570), taught by Professor Ryan Thornburg.


