Mapping & GIS
Basic Mapping vs. Spatial Analysis
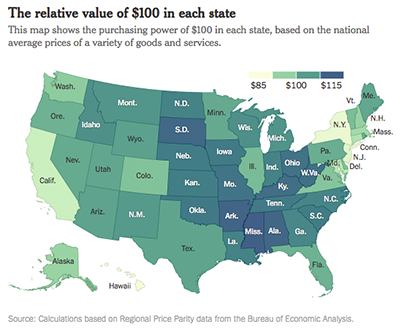
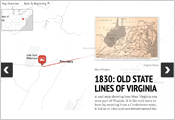
A choropleth map published by The New York Times.
Maps visualize location information, i.e. spatial data. Basic maps are commonly used to display multiple locations, show paths or connections between different locations, or demonstrate quantitative values related to a location, as seen in choropleth maps. These types of maps can be created using basic data visualization tools and do not require specialized knowledge of GIS (Geographic Information Systems).
Spatial analysis allows us to answer more complex questions about spatial data than a basic map can usually accommodate. Some examples of these questions might be, "Which schools in the U.S. are within a mile of sites that release carcinogens?" and "How do differences in lake volume correlate with shoreline levels?" You will not be able to use basic data visualization tools to find sufficient answers to these questions. Instead, you will need to use more complex GIS software. You may also require the assistance of a GIS Librarian.
Spatial Data
There are many resources for finding spatial data. Note that different sets of spatial data are recorded at different levels of granularity. For example, city level data is more granular than county-level data, which is more granular than state-level data and so on. Different data visualization tools will only work with spatial data at certain levels of granularity, so it is important to learn about the geographic capabilities of the tool you want to use before locating or collecting spatial data.
The most granular level of spatial data includes geographic coordinates of latitude and longitude values. Most data visualization tools will not accept street or postal address data and instead require geographic coordinates. Converting other types of location information into geographic coordinates is called geocoding. Geocoding can be done either manually by using Google Maps or automatically through a tool like ArcGIS Pro. For help with geocoding, please contact library staff.
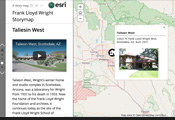
Story Maps
Story mapping tools allow you to make a basic map more informative and engaging by adding text, images, sound recordings, videos and website links. Story maps also serve as interactive websites for map-related projects. If you are interested in learning more, contact a Data Visualization Librarian.
Tools for Creating Basic Maps and Story Maps
|
TableauTableau produces a wide variety of beautiful interactive visualizations and maps, and its drag-and-drop interface makes it easy to learn and use. A free academic license is available to students, instructors, and non-profit academic researchers. Publishing visualizations on the web requires a Tableau Public account. Public visualizations should not use private or personally identifiable information. |
|
ArcGIS OnlineArcGIS Online is a lighter, more user-friendly version of its elaborate counterpart, ArcGIS Desktop. Spatial data can be easily uploaded from spreadsheets to make customized, interactive web maps. Licenses for ArcGIS Online are provided to students, faculty and staff through the Davis Library Research Hub. To log in to ArcGIS Online, follow the instructions on the GIS Software Guide. |
 |
ArcGIS Online Story MapsStory Maps allow you to create interactive web apps for your ArcGIS Online maps. Users can guide their audience around their map while incorporating text, images, video and more. Licenses for ArcGIS Online are provided to students, faculty and staff through the Davis Library Research Hub. To log in to ArcGIS Online, follow the instructions on the GIS Software Guide. |
 |
Knight Lab Story MapsAlthough Knight Lab Story Maps do not allow for the same level of customization as ArcGIS Online Story Maps, they do have one advantage: they're free with a Google account and do not require you to sign up for a license. They also provide a simpler and more basic interface while still incorporating a wide variety of media options. |

