 Data Visualization Help
Get help from a Data Visualization expert.
 Guest Lectures & Workshops
Schedule a speaking engagement for your class or group.
 Data Visualization Basics
Learn the purpose and benefits of using data visualization, and find out what you will need before starting a project.
 Infographics
What’s the difference between data visualization and infographics?
 Mapping & GIS
Discover how basic mapping differs from complex spatial analysis.
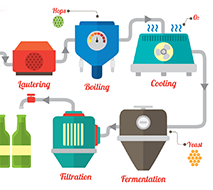 Qualitative Visualization
Learn what qualitative visualization is and the different methods for visualizing qualitative data.
 Network Visualization
Discover network analysis and how networks can be visually described.
 Programming
Understand why you might want to use a programming language to create data visualizations.
 Training & Tutorials
Find videos, web tutorials and workshops at UNC-Chapel Hill for learning different tools and practices related to data visualization.
![]()
 Reading
Discover books and articles about data visualization available through the University Libraries.
 Inspiration
Get links to data visualization blogs, beautiful portfolios, projects and inspirational videos.
Graphics by Vecteezy


