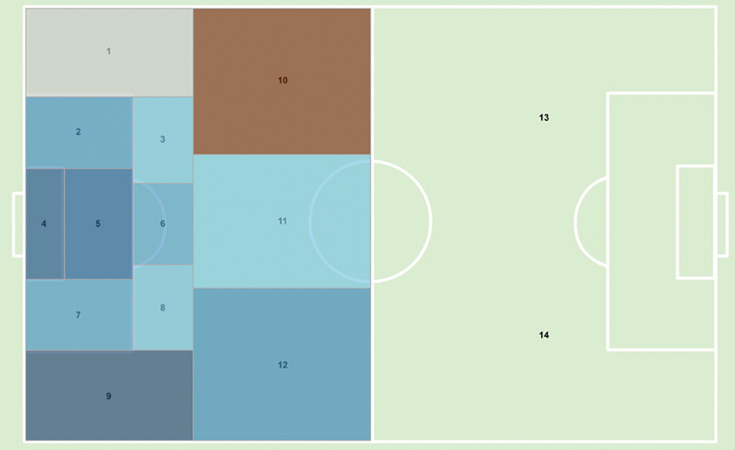
A Business and Mathematical Decision Sciences student consulted with Research Hub staff to visualize shot pattern data from the women’s soccer team.
The student had recorded zones and quality of each shot, and Research Hub staff helped reformat the data and prepare visualizations. Microsoft Excel, ArcGIS and Tableau were used to reformat, spatially reference, and visualize the data.
Women’s Soccer Team Shot Patterns Analysis


